Instant Integration

Fastest way to make sense of your numbers

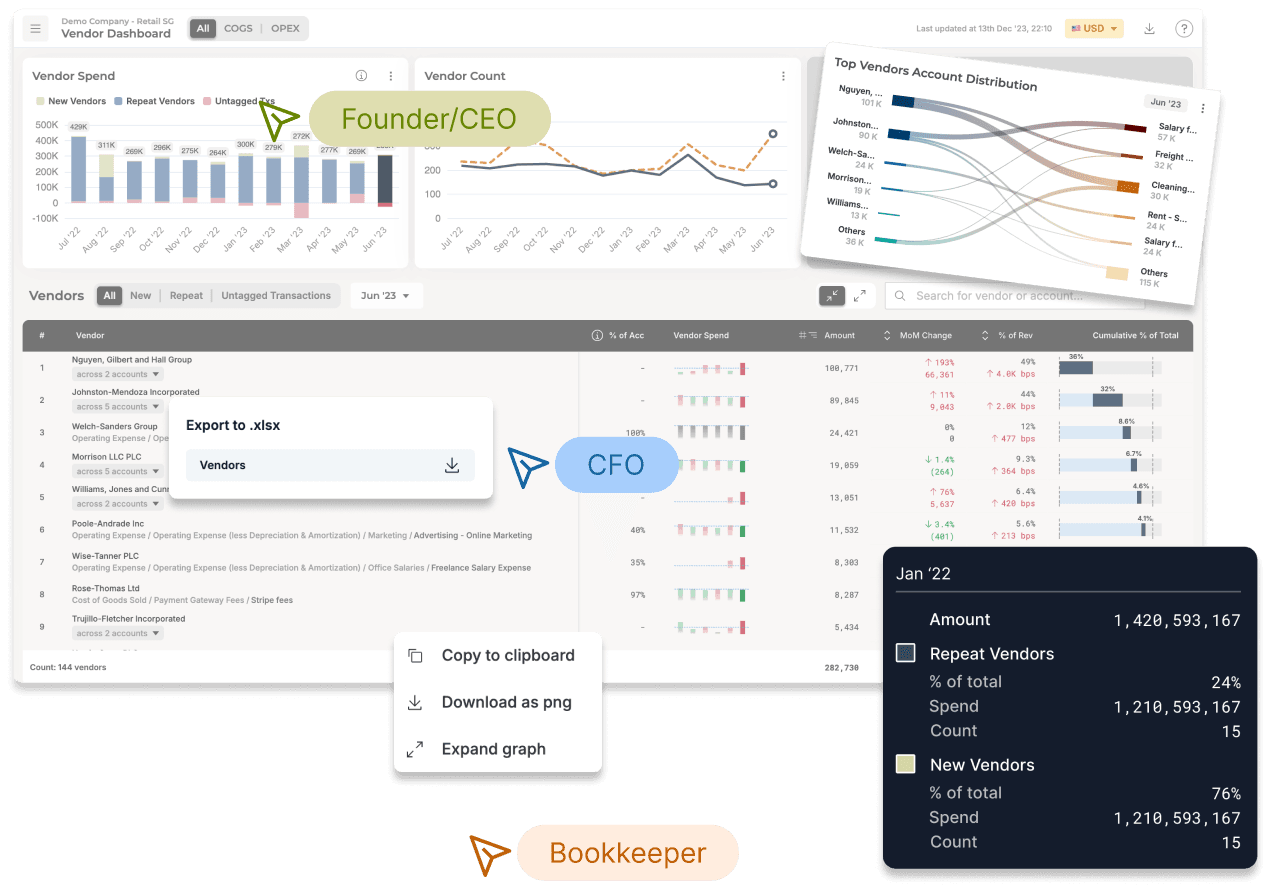
One-Click Visibility
Drill down into transaction-level details and uncover key variance drivers instantly for sharper financial insights.
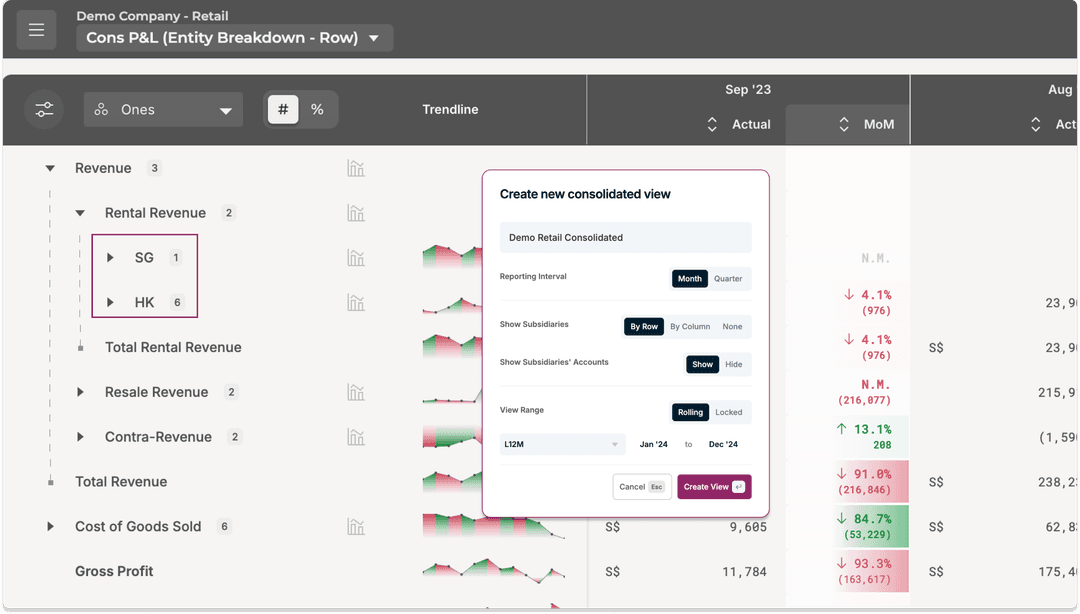
Versatility
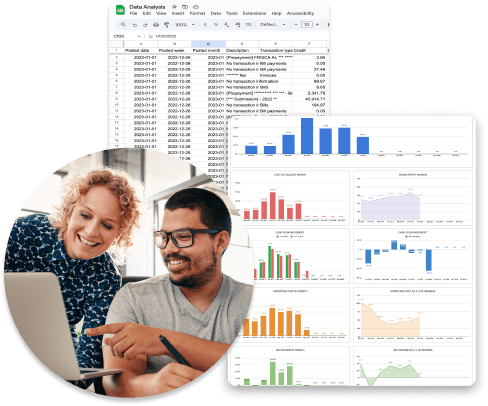
Invite stakeholders to Bunker's innovative platform, generate a variety of reports in the spreadsheet of your choice.
Plug & Play Simplicity
Easily connect your company in minutes and start generating actionable insights. No complex configuration required.
Scalable Efficiency
Accelerate your company’s growth by automating analysis and reporting to focus on high-level strategy and decision-making.
Why Customers Choose Us
Instant Drilldowns
Instantly drill down to the details behind the numbers, without ever leaving the page.
Learn MoreWhy Users Love Us
Celadon Partners reduced time spent across monthly financial reporting, trend spotting, attribution analysis by 70%.
“Bunker is as deep as a quality-of-earnings report on a real time basis, not only optimising reporting, but also enabling strategic decision making. Its transaction-deep dashboards and excel exports are structured the way I used to when I was an investment banker.”
Read More
EMA Global's CFO leveraged Bunker to drive operational strategy and optimise its FP&A across its 6 entities in SEA.
“Bunker completely flipped the script for us – we went from spending hours trying to understand the story and how to tell it – to having the story laid out rigorously but simply and formulating actionable insights on cash flow and business strategy.”
Read More
CFO Pro+Analytics built a scalable Fractional CFO practice while ensuring client value through Bunker.
“Since using Bunker, I've been able to deliver more comprehensive financial insights than most large financial services firms. It's less about time and more about an elevated conversation for all things finance, accounting, and most importantly, strategy.”
Read More
Trusted by Advisors and Finance Teams


Your Data, Fortified with Bunker
Global Security Standards
We follow industry best practices and rigorous information security management to keep your data safe.
Certifiably Secure
Bunker is SOC 2 Type II certified, a trusted standard developed at American Institute of Certified Public Accountants (AICPA).
EU Data Protection
Privacy is at the core of our data practices and we are adherent to EU's General Data Protection Regulation (GDPR).


