Features

Discover a robust ecosystem of features designed to elevate every aspect of your financial operations

P&L View - Your Financial Story, Visualized

Transform static financials into interactive insights across your entire organization.

  • Interactive Waterfall Charts
  • Multi-Entity Consolidation
  • Preserved Chart of Accounts
  • One-Click Drilldowns

Cash Flow Dashboard - Liquidity in Living Color

Navigate your cash position with unprecedented clarity and depth.

  • Interactive Color-Coded Visualizations
  • Customizable Date Ranges
  • Detailed Cash Flow Trends

Vendor Dashboard - Master Your Vendor Landscape

Go beyond spend management with GL-level vendor insights.

  • Aggregated Spend Analysis
  • One-Off Transaction Spotting
  • Vendor Relationship Timelines
  • Comparative Vendor Performance

AR Dashboard - Receivables Reimagined

Transform your collections strategy with data-driven insights.

  • Interactive AR Aging Scatter Plot
  • Bad Debt Risk Assessment
  • Collections Priority Queue

Overview Dashboard - Your Financial Command Center

Gain instant, comprehensive insights into your company’s financial pulse.

  • Consolidated Financial Overview
  • Real-Time Performance Metrics
  • Interactive Trend Visualizations
  • One-Click Drill-Downs to Detailed Reports

One View to See Them All

Seamlessly navigate the P&Ls across multiple entities, consolidated by a unified chart of accounts. See everything – from high-level P&L at a glance to the deepest details of an individual entity
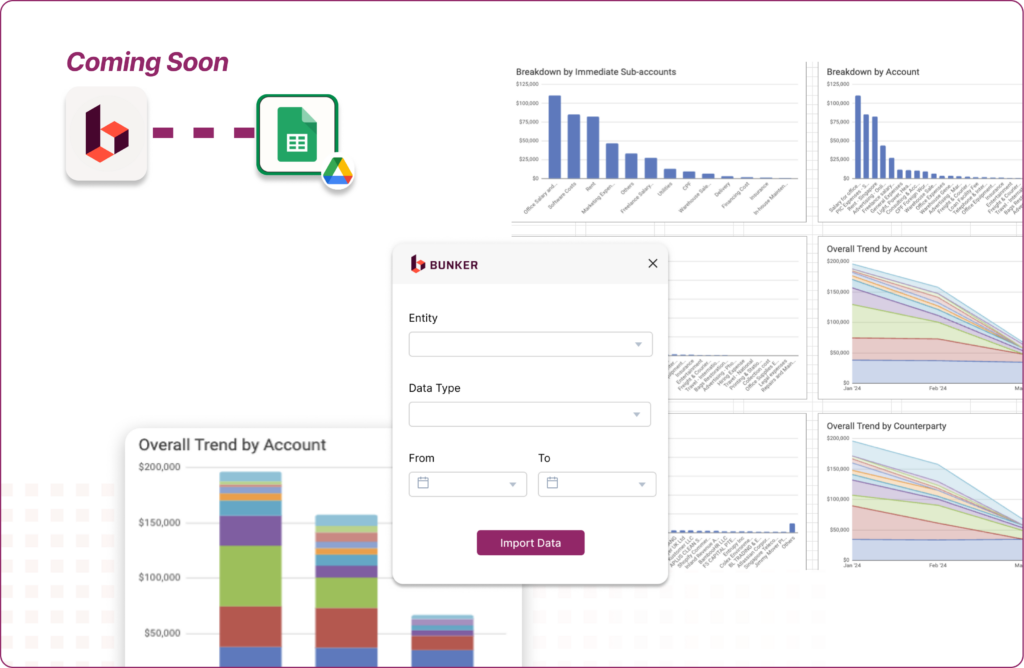
 

Transform raw financial rows into insights with actionable power

Scan the code